Aranet Cloud Bar charts

aranet-techsupport
Posted: 20.12.2024 09:05
Modified: 16.02.2026 19:50
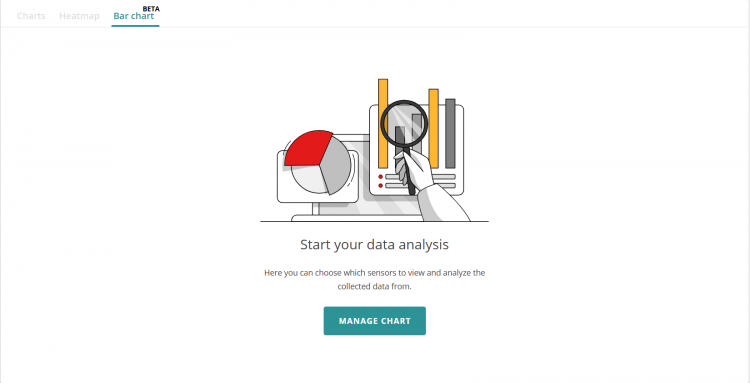
With Aranet Cloud v2.3.14 new bar charts are added to the analytics page. Although currently they are in BETA.

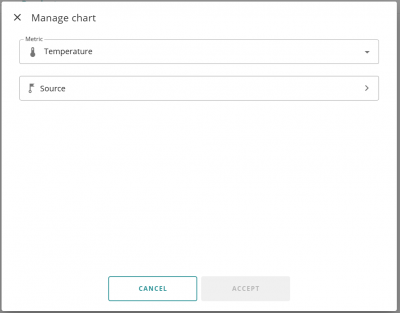
When managing the chart you will be greeted with this screen:

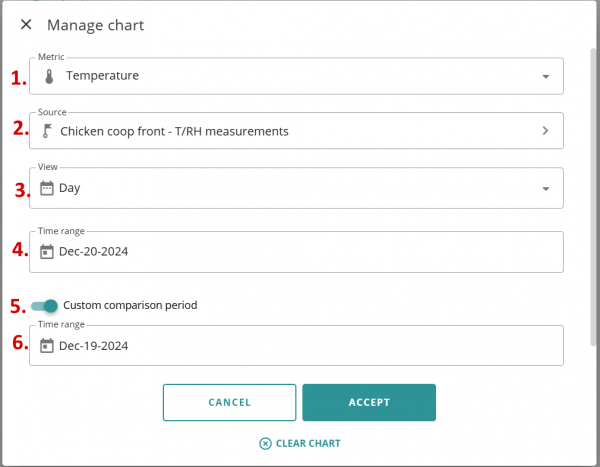
From here you will choose the metric and the source of data for that metric as well as other parameters.

- Metric: choose the metric you want to view as a bar chart
- Source of the data for that metric
- Choose the DAY or MONTH to view the data by hour or by day
- The time range for the bar chart
- Enable or disable custom comparison period, which allows you to compare two different days or months in the same chart of the same sensor.
- The time range for the comparison
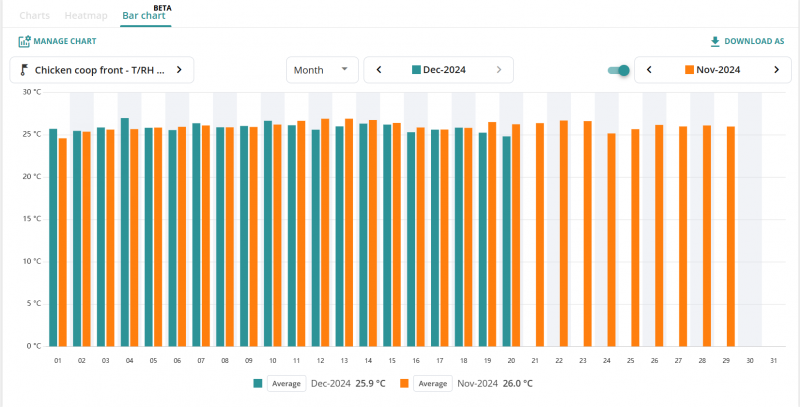
After choosing the specific parameters you will see the bar chart itself:

This is really useful for something like an Energy meter to compare different months and see how the electricity usage changes month to month.
You have to log in to reply.