Aranet Cloud Heatmaps

aranet-techsupport
Posted: 30.04.2024 08:12
Modified: 16.02.2026 23:46
With Aranet Cloud version v2.0.56 you can use Heatmaps to better illustrate your data.
First, go to the Heatmap page.
Go to Analytics, Heatmap and click on Manage chart
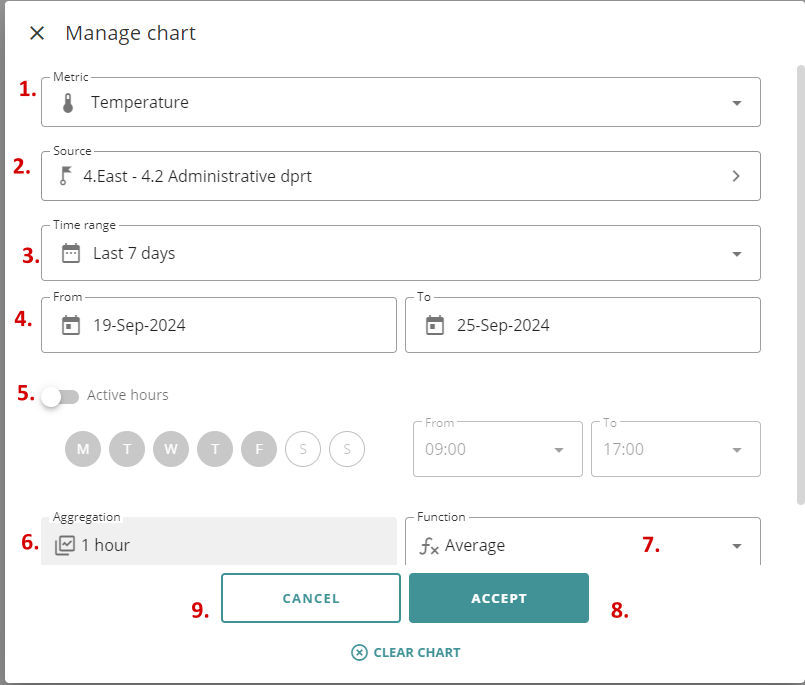
You should be greeted by the following screen:

Where:
1. Which metric do you wish to select
2. From which sensor should the metric be selected
3. The time range the data will be taken from. This week, last week, last 7 days or custom
4. If custom, then edit the dates here. Only max of 7 days are currently available.
5. Active hours. allows you to select the active hours to make sure you are displaying only relevant data.
6. Aggregation time, currently only one hour is available
7. Chooses the function, between average, min and max (Total if energy in kWh is selected).
8. Accepts and saves the configuration
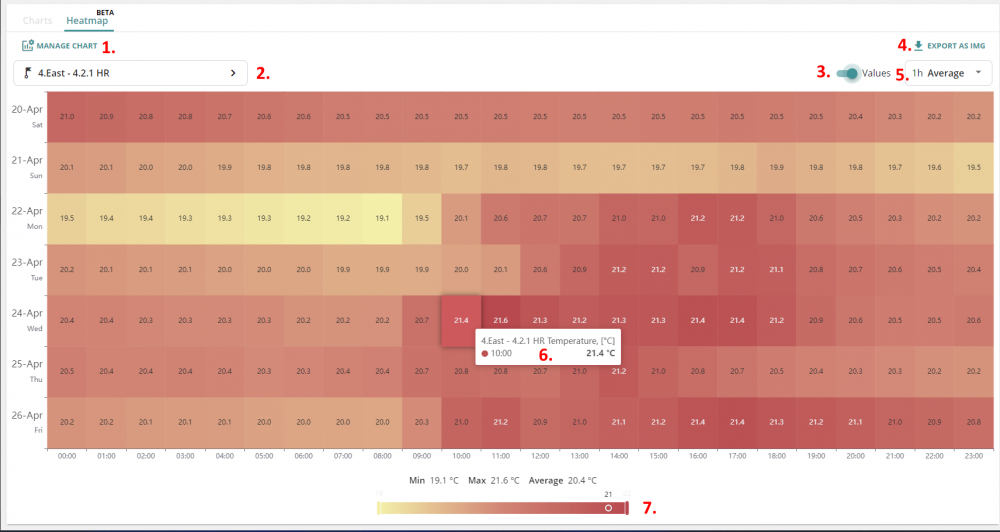
9. Cancels the editWhen you are done with the setup, you will be able to see the heatmap itself:

1. Opens the edit chart page, allowing you to change the options.
2. Allows you to quickly change the sensor being looked at.
3. Enables the showing of values on the heatmap blocks
4. Allows you to export the heatmap as an image
5. Allows you to change from average, min or max values shown. (Total if energy in kWh is selected)
6. By hovering the mouse over any block, additional info can be found, like the time, and exact metric.
7. It allows one to quickly look at specific values and set the min or max values to show on the heatmap.
If an energy meter is selected, selecting Total in the function field allows you to see your energy consumption by day.
You have to log in to reply.