How to configure Gauge widget

aranet-techsupport
Posted: 31.03.2022 13:56
Modified: 30.03.2026 18:43
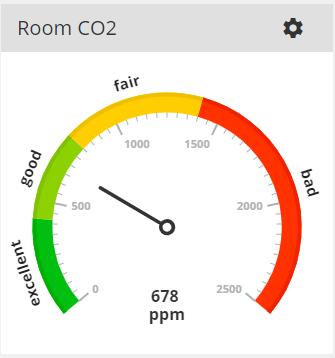
Aranet Cloud dashboard tile Gauge widget presents sensor data in a "speed-o-meter' view.
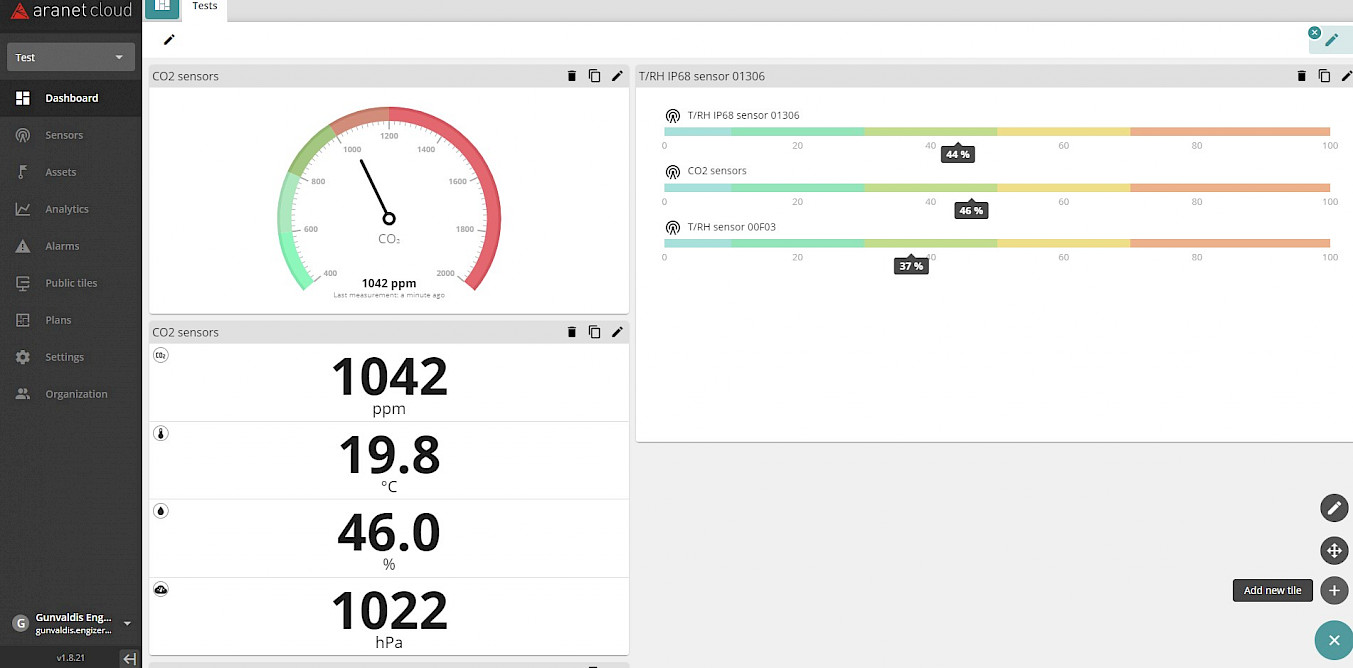
The tile can be created in a usual way: from the Dashboard or from the Sensors view:- Open Dashboard, click on "GEAR" icon in the right lower corner and then click on "+" to add new tile
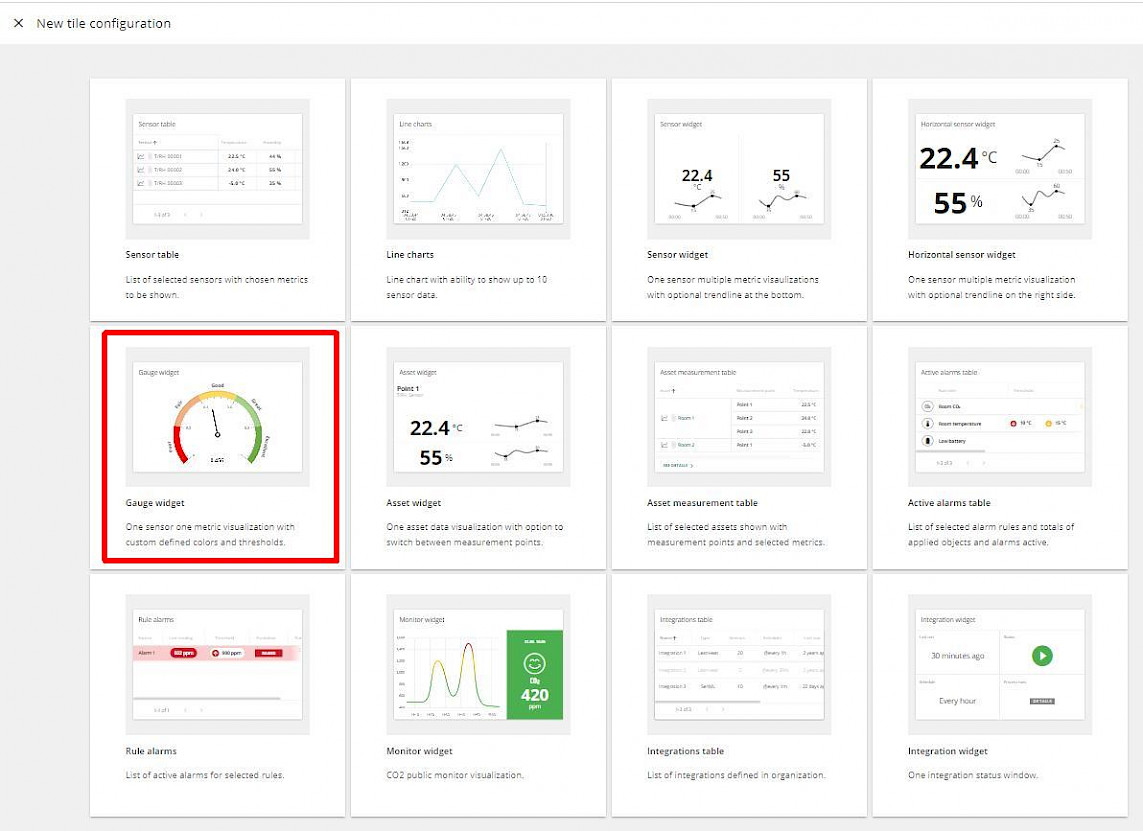
- Select Gauge widget from the Tiles in opened window:
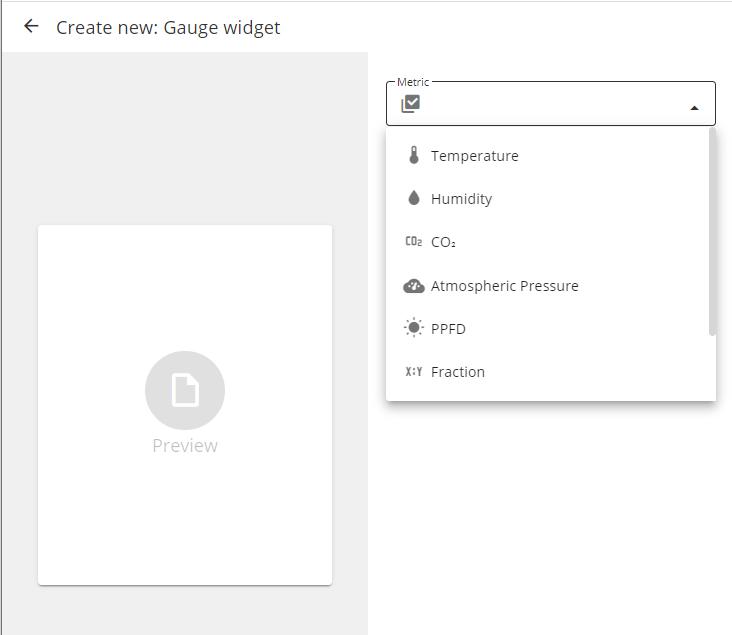
- Tile configuration page will open.
Select Metrics of the tile from drop-down list:
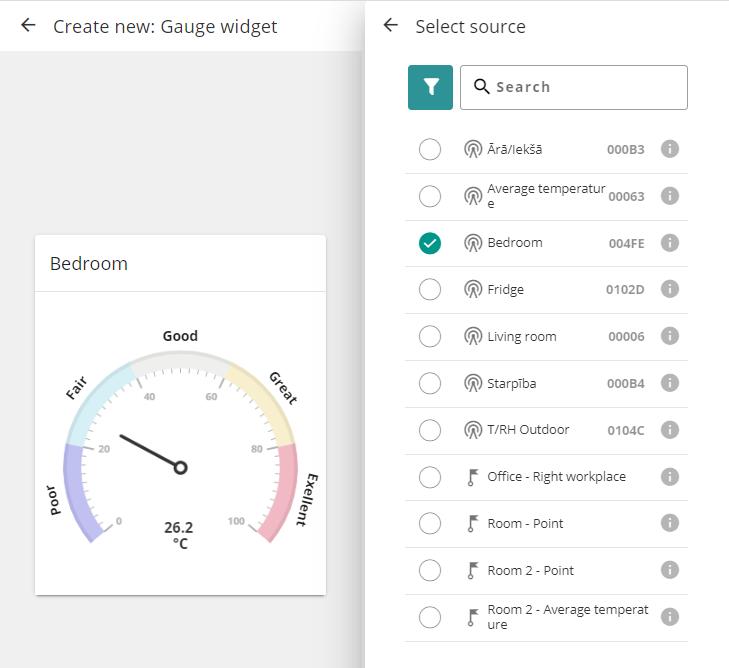
- Select the source of the data for the tile; you can filter by Locations and Tags:
- Now you have the ability to adjust:
a) Tile Title;
b) Thresholds visibility;
c) Start, End, and Intermediate thresholds values;
d) Sector colors - by clicking on color plate;
e) Sector labels;
f) Number of sectors - by marking/unmarking check-boxes
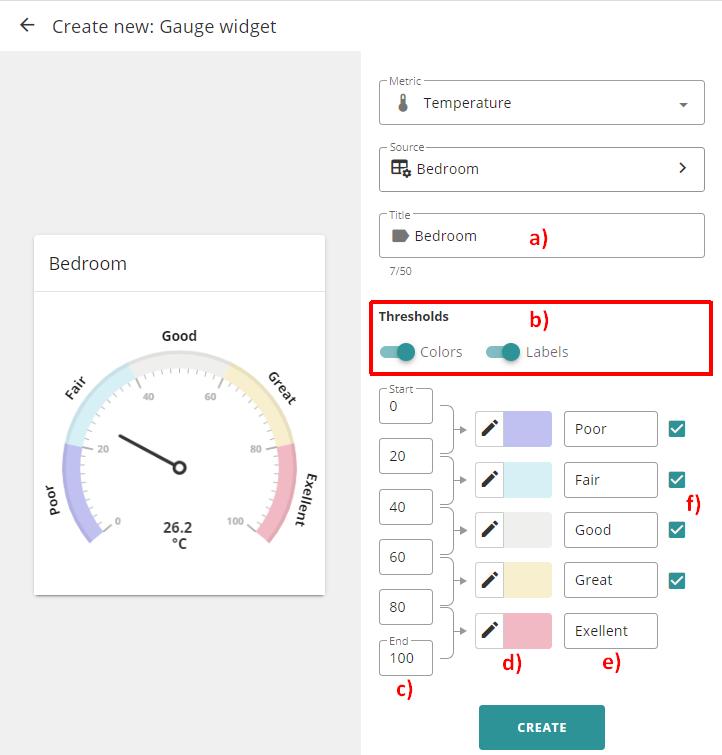
When all corrections are made, click CREATE button to finish.
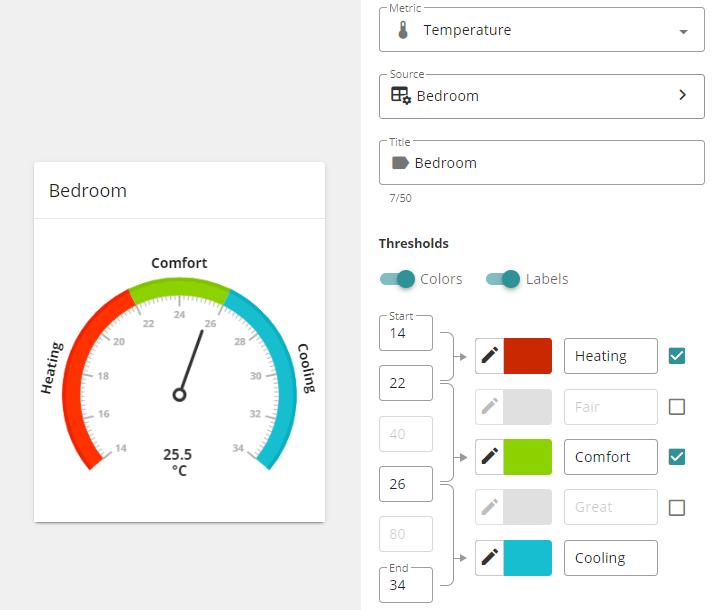
Let's consider some examples of Temperature sensor applications and possible corresponding gauge configurations.
- Living Room Temperature sensor
Assuming that comfort temperature is between 22 and 26 degrees Celsius, the configuration and view can be following:
- Freezer Temperature sensor
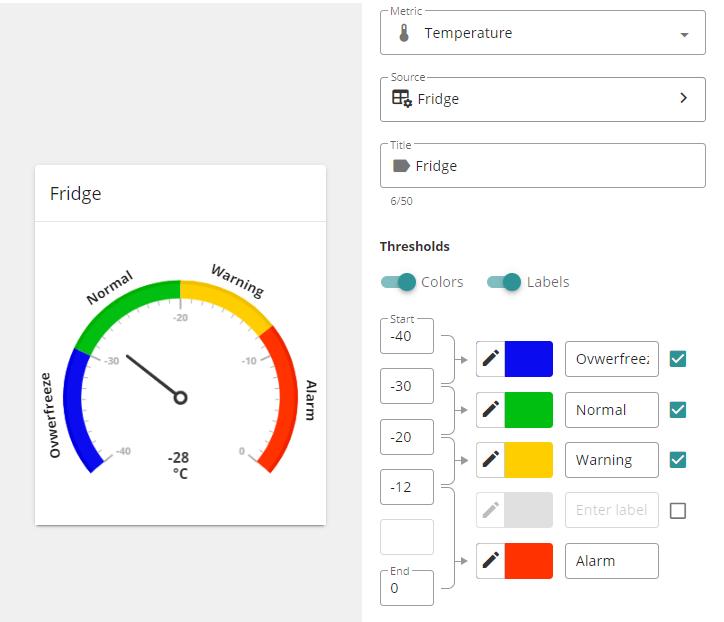
In a similar way, you can adjust the Gauge widget to your own needs.
- Open Dashboard, click on "GEAR" icon in the right lower corner and then click on "+" to add new tile
You have to log in to reply.