How to manage Dashboards in Aranet Cloud?
aranet-techsupport
Posted: 12.09.2022 12:42
Modified: 10.05.2026 08:27
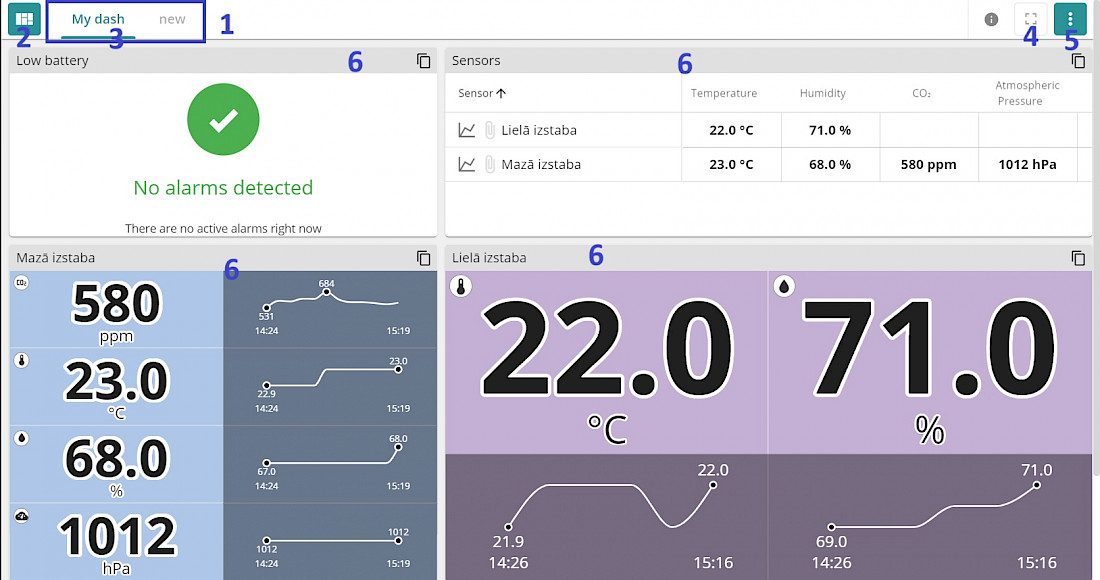
Dashboard is the main display you see when you open Cloud. A dashboard shows sensor data and gadgets that provide different types of information to aid you and your workspace members as you monitor and track measurements and Your environment. Each user can create his custom dashboard (up to 10 dashboards per user) to see only the data, that he is interested in. Dashboards can be named and shared with other workspace members. Dashboard contains Tiles - items, that display some information.
Dashboard view:
- Tabs of User favorite dashboards
- Dashboard favorites "Edit" button
- Current dashboard name
- Fullscreen mode switching button (press "Esc" to exit fullscreen mode)
- Dashboard "Edit" button (see detailed below)
- Tiles
When you start using Aranet Cloud your dashboard is empty:
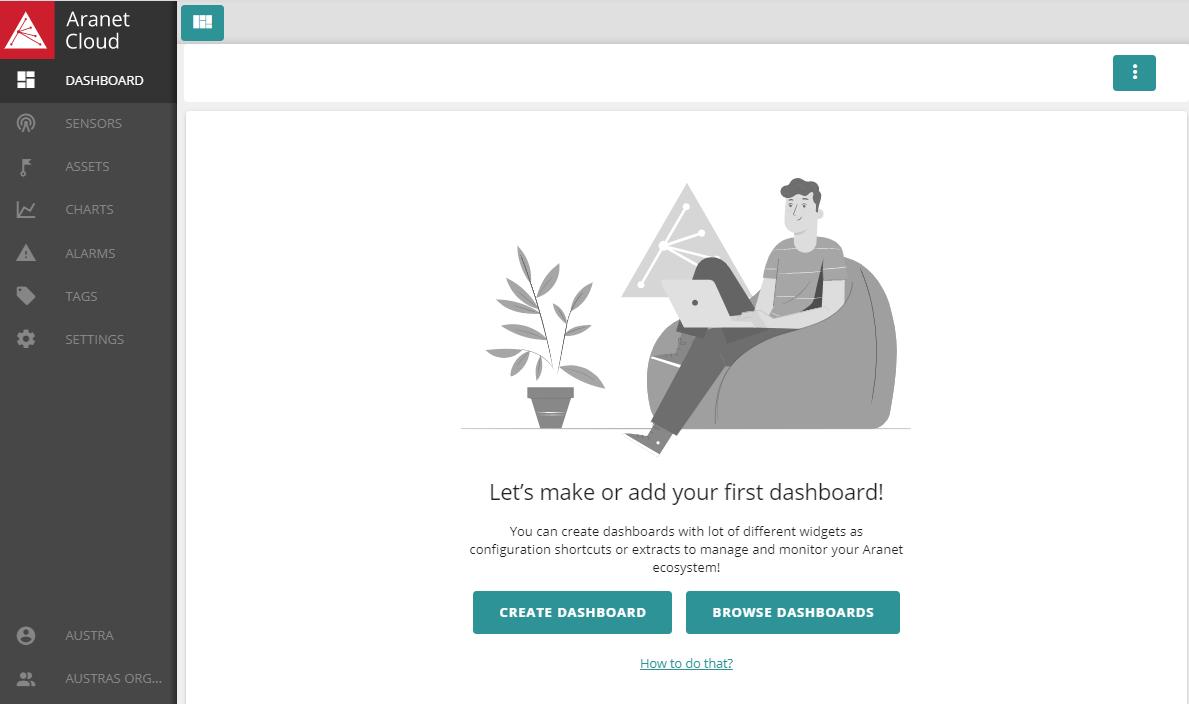
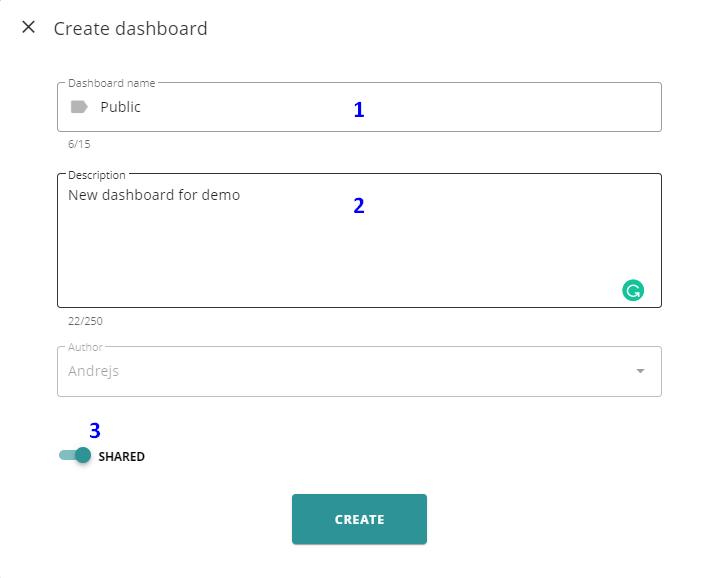
Pressing on CREATE DASHBOARD opens New dashboard creation pop-up window (the same window is accessible when Dashboard "Edit" button (5) is pressed):
Enter dashboard name (1), description (2) and select "shared' (3) if you want to share this dashboard with other members of your workspace. Click CREATE button to finish:
New dashboard tab appears in the favorites and you are offered to add tiles to this dashboard:
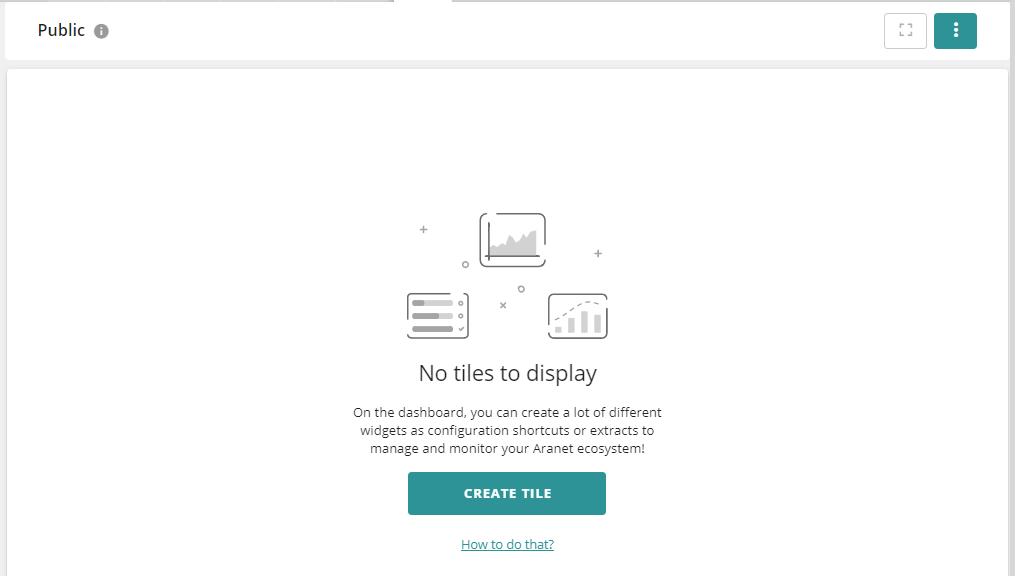
See information about Aranet Cloud Tiles below.
Pressing BROWSE DASHBOARDS is equivalent to pressing on Favorites "edit" button (2) and opens pop-up window presenting all shared dashboards in your workspace. Marking check-boxes add dashboards tabs to favorite and to MY CHOICE list:
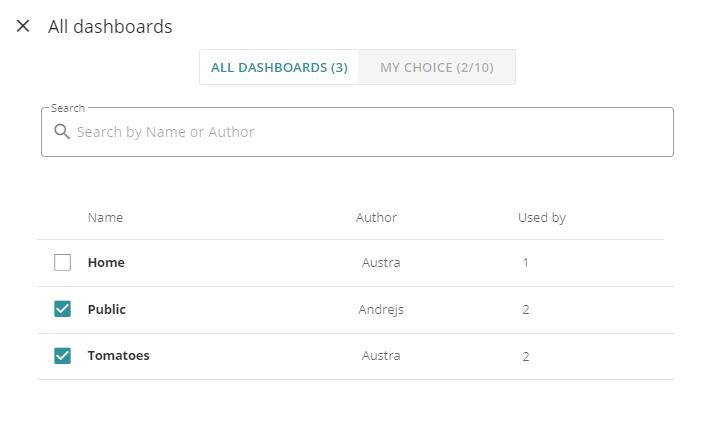
Correspondingly to above visible selection, two dashboard tabs should be visible - Public:

and Tomatoes:

Dashboard editing.
After clicking on "Edit" button pop-up menu opens:

Selecting "Edit this dashboard" will activate additional buttons:
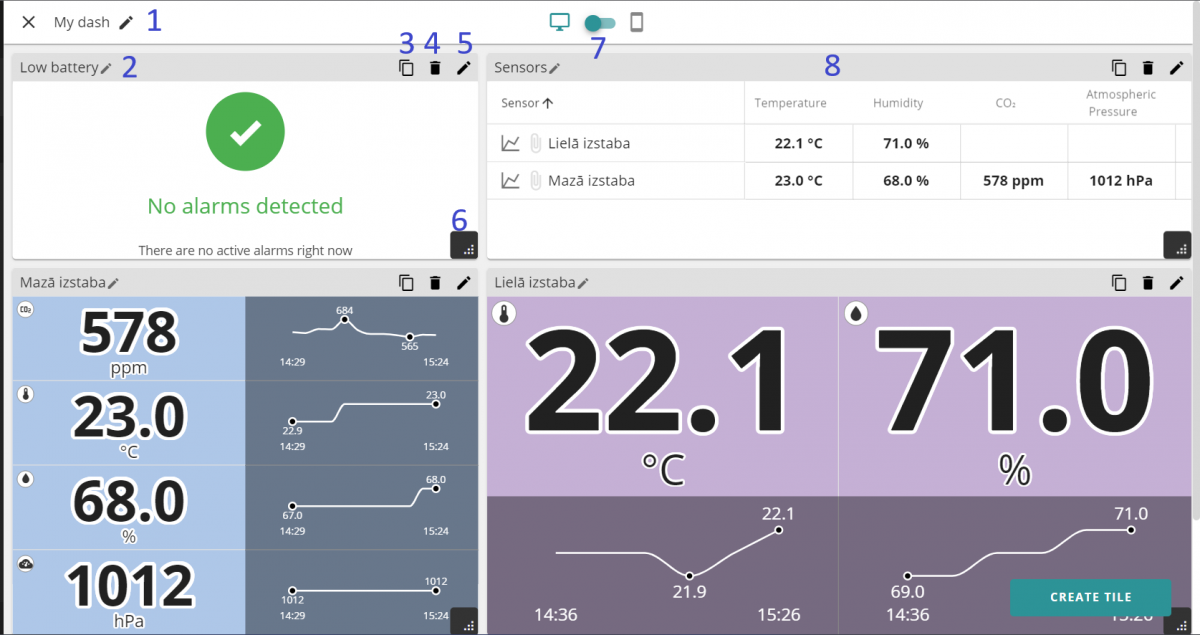
1."Edit dashboard data" allows changing data entered at dashboard creation stage or delete current dashboard.
2. Allows you to "Rename" the tile.
3. and 4. allows you to either "Copy" or "Delete" the tile.
5. "Edit the tile" allows you to edit the parameters of the tile.6. and 8. Allows you to "Resize" or "Move" the tile.
7. Allows you to swtich to mobile view.
Arranging tiles in desktop view and in mobile phone view differs. While in desktop view the position and size of the tile can be chosen almost freely, in mobile phone view only vertical tiles arrangement is possible and three tile sizes are available - Small, Medion, Large
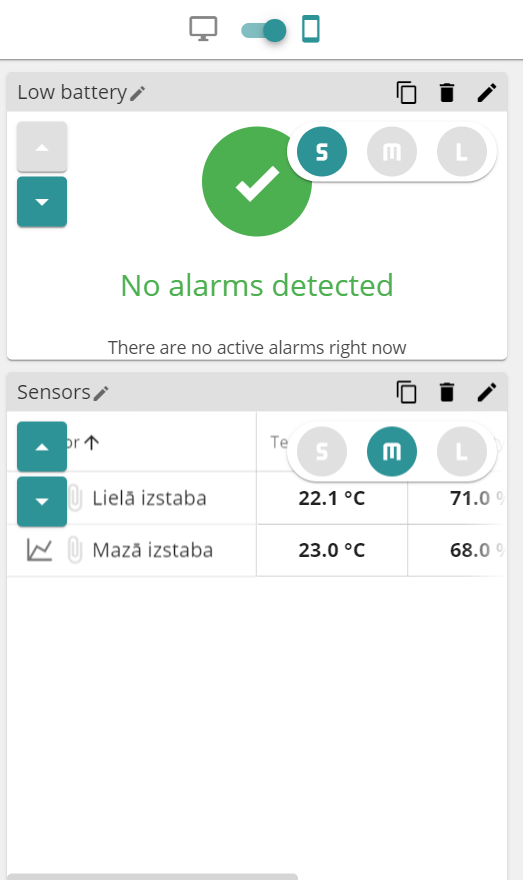
To exit dashboard editing mode click dedicated button.
- Clicking on CREATE TILE button on the empty dashboard
- Clicking on Add new tile button in dashboard editing menu
- Clicking on Add to Dashboard button
 on other Aranet Cloud screens.
This will open window presenting available tiles thumbnails:
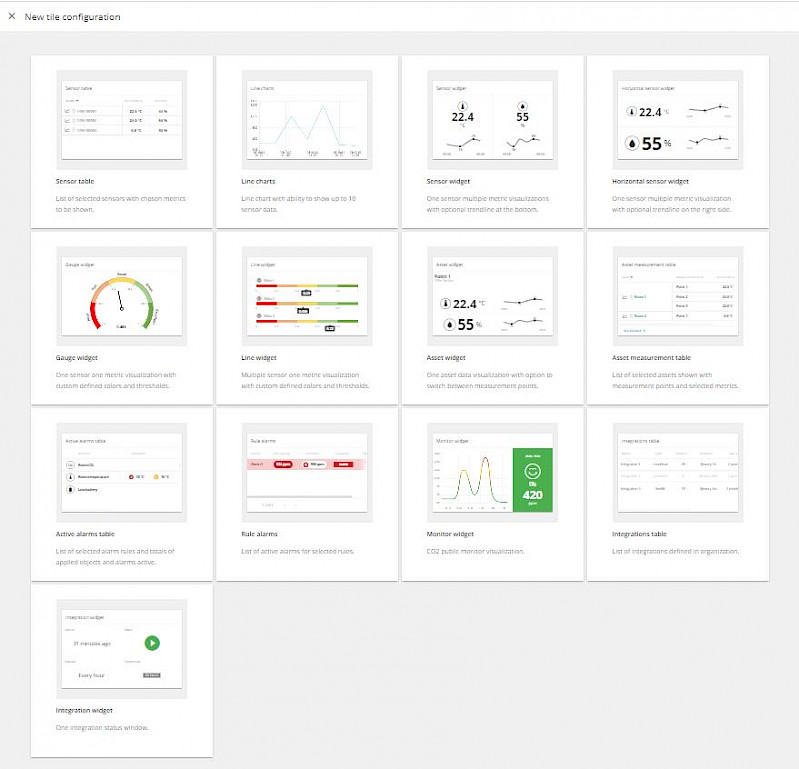
Click on the desired tile thumbnail to open tile configuration window.
Current Aranet Cloud version includes the following types of dashboard tiles:
Sensor table - displays sorted table with user-chosen sensors.
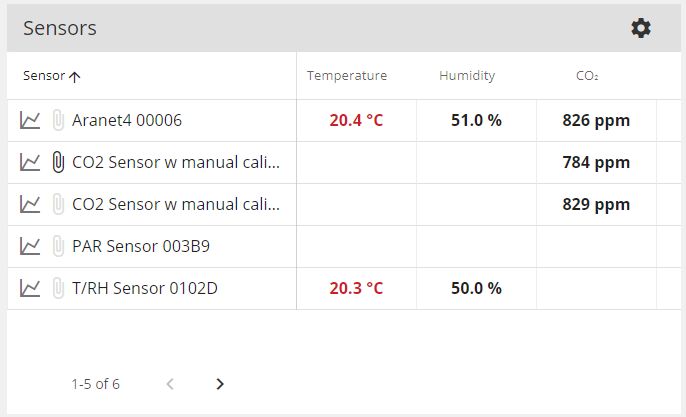
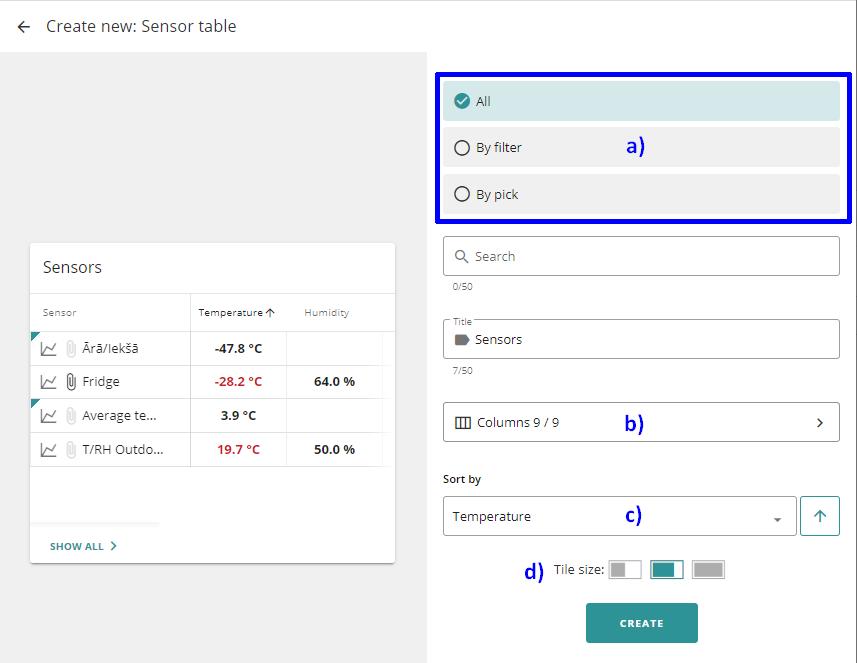
This tile configuration allows
a) selecting and filtering sensors (by Metrics, Type, Location, Tag);
b) choosing visible columns (Metrics);
c) sorting sensors in a table by Name or the value of the Metric
d) selecting tile size (Small, Medium, Large).
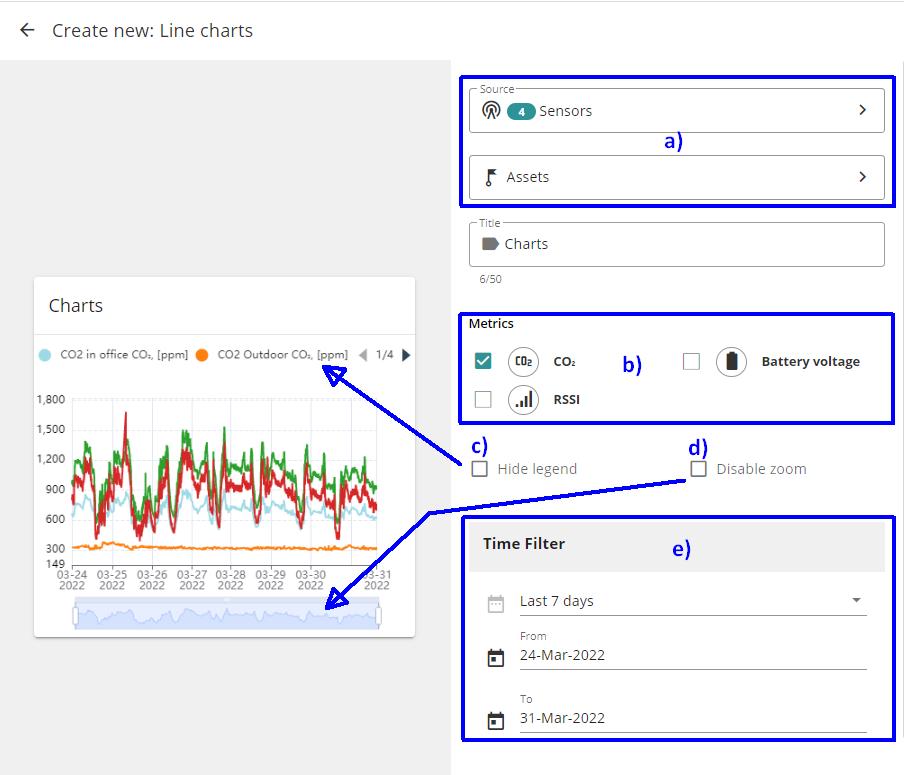
Line chart - displays line chart diagram of few sensors. Currently allows to add up to 4 sensors in one chart.
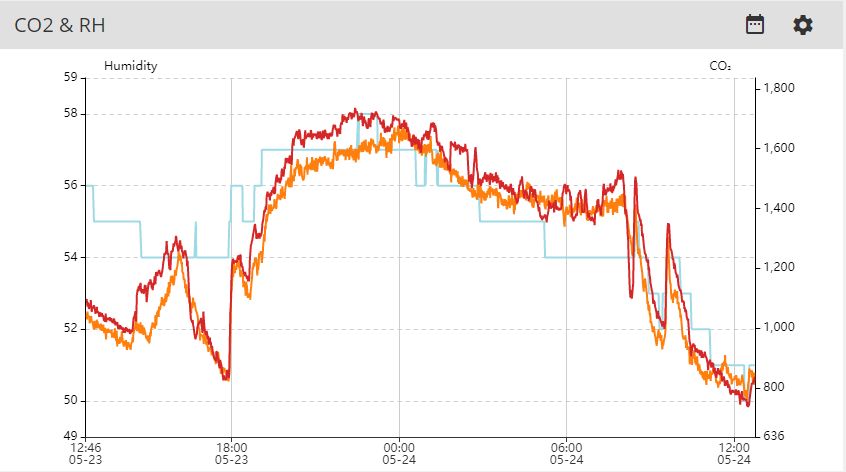
This tile configuration allows:
a) Selecting and filtering sensors (by Metrics, Type, Location, Tag);
b) Selecting metrics to display;
c) Hide/Show Legend;
d) Enable/Disable zoom;
e) Apply Time filter
and selecting tile size (Small, Medium, Large).
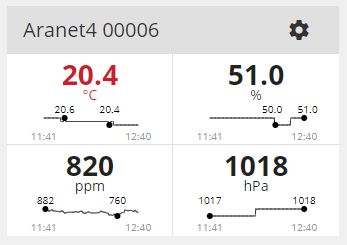
Sensor widget - displays one sensor's current measurements. Sensor widget can includ trendline, that displays measurement changes within a defined period.
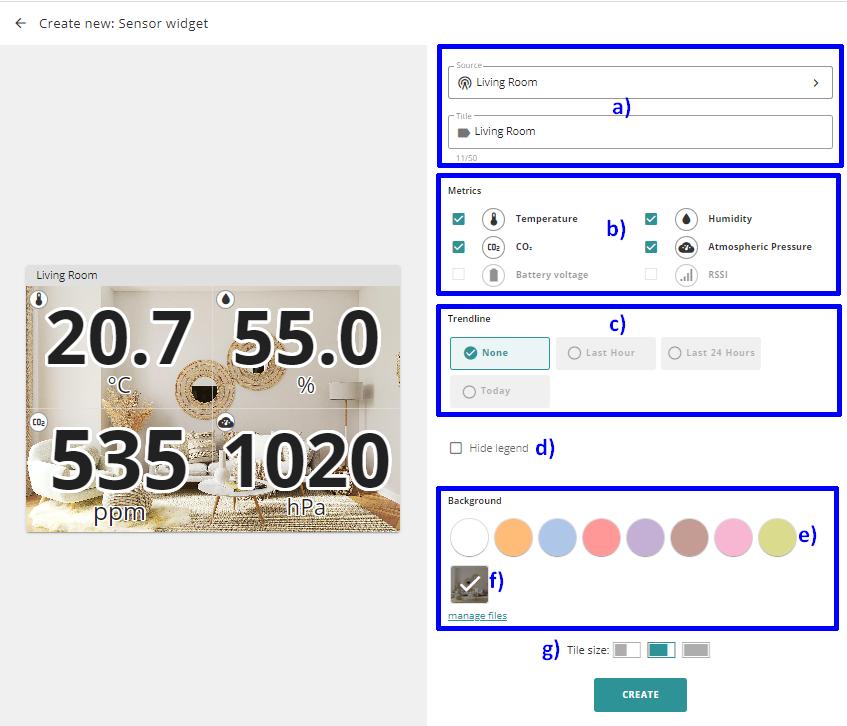
This tile configuration allows:
a) Selecting and filtering sensors (by Metrics, Type, Location, Tag);
b) Selecting metrics to display;
c) Selecting trendline (None, Last Hour, 24 Hours, Today;
d) Hide/Show Legend;
e) Selecting the background color
f) Selecting background picture (if any available in sensor configuration)
g) And selecting tile size (Small, Medium, Large).
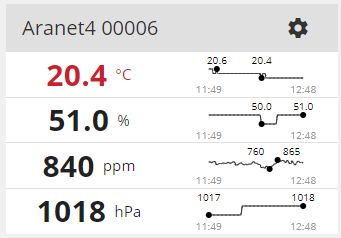
Horizontal Sensor widget - displays sensor's data in horizontal lines view.
This tile configuration is the same of Sensor widget.Gauge widget - displays one sensor one metric data in "speed-o-meter" view.
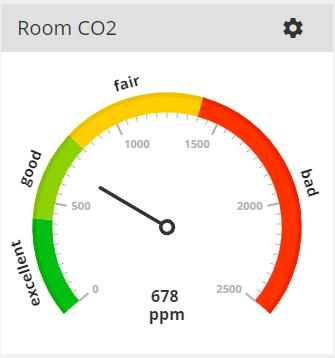
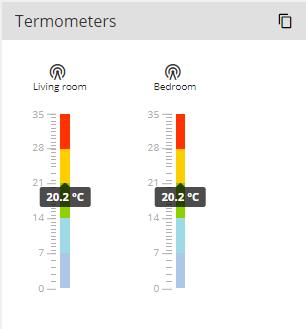
This tile configuration is described in the dedicated forum topic: How to configure gauge widget.Line widget - multiple sensors one metric visualization in linear view with custom-defined colors and thresholds.
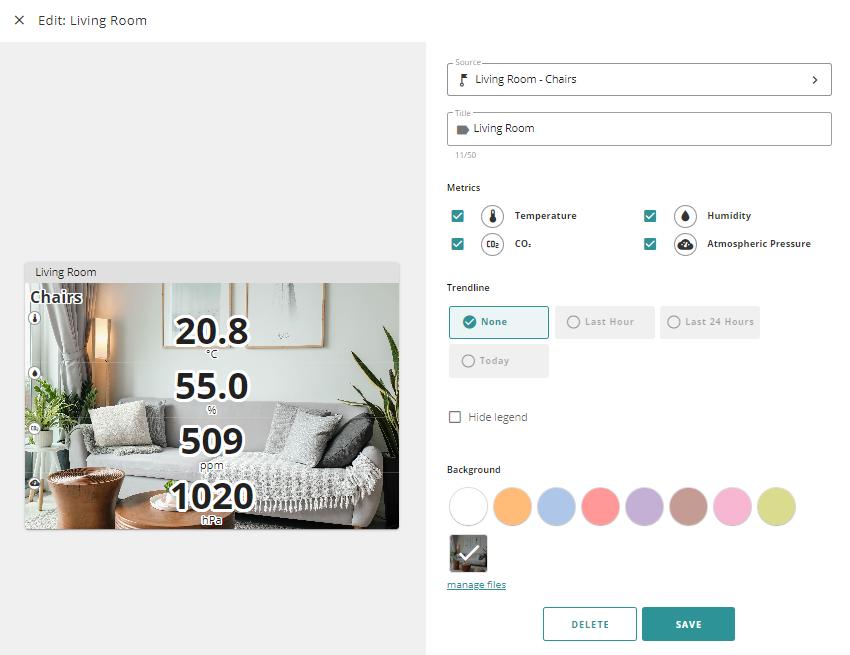
This tile configuration is described in the dedicated forum topic: How to configure Line widget.Asset widget - one asset data visualization with option to switch between measurement points.
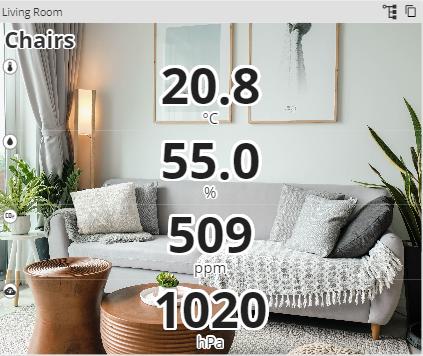
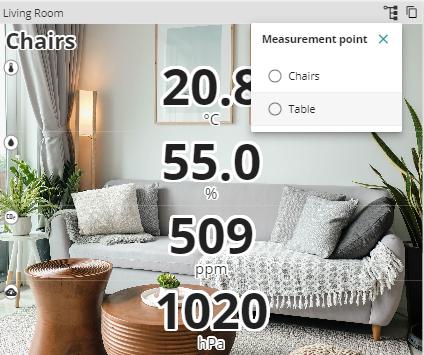
This tile configuration allows choosing Data source (asset), Metrics, Trendline, Background colour, image, and selecting tile size (Small, Medium, Large):
Asset Measurement Table - displays list of selected assets shown with measurements points and selected metrics
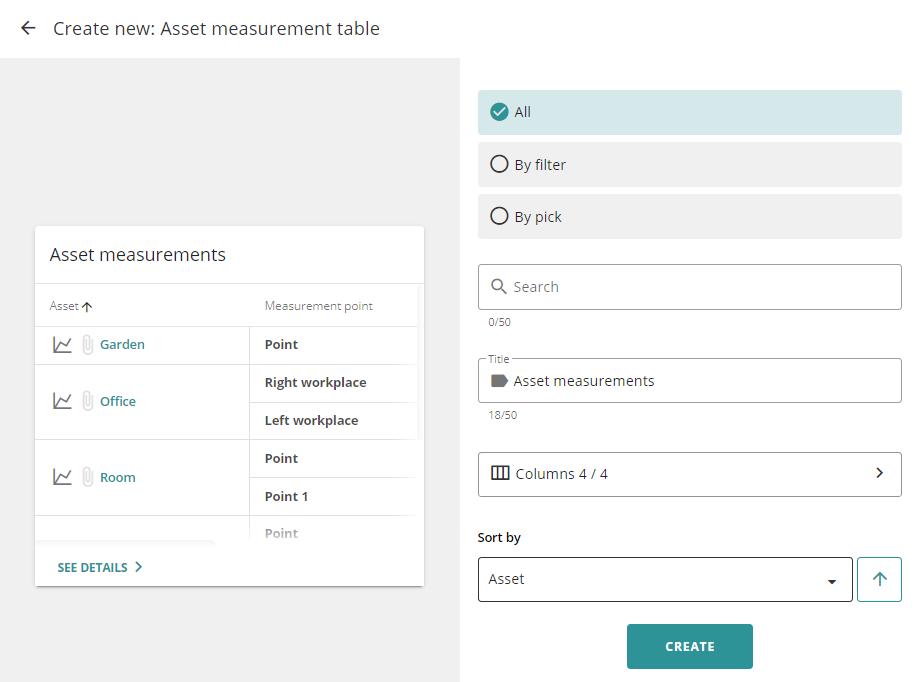
This tile configuration is the same as of Sensor table.
Active Alarms table - displays list of active alarm rules and totals of applied objects and alarms active.

This tile configuration allows selecting Metrics, columns, Sorting order and Tile size:
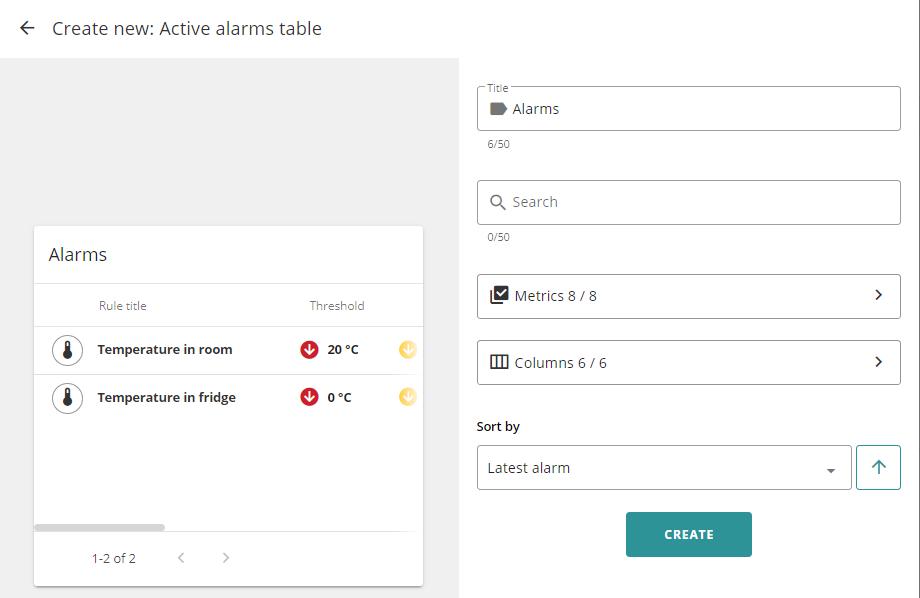
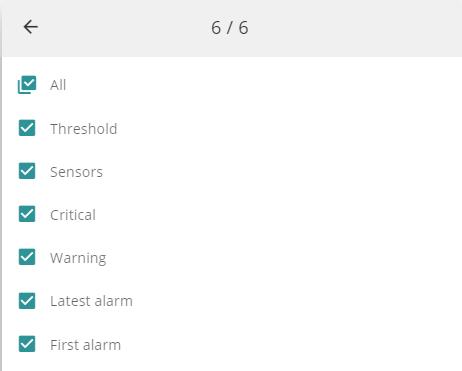
Columns represent Alarm Rule:
Rule Alarms widget - displays list of active alarms of selected rule:
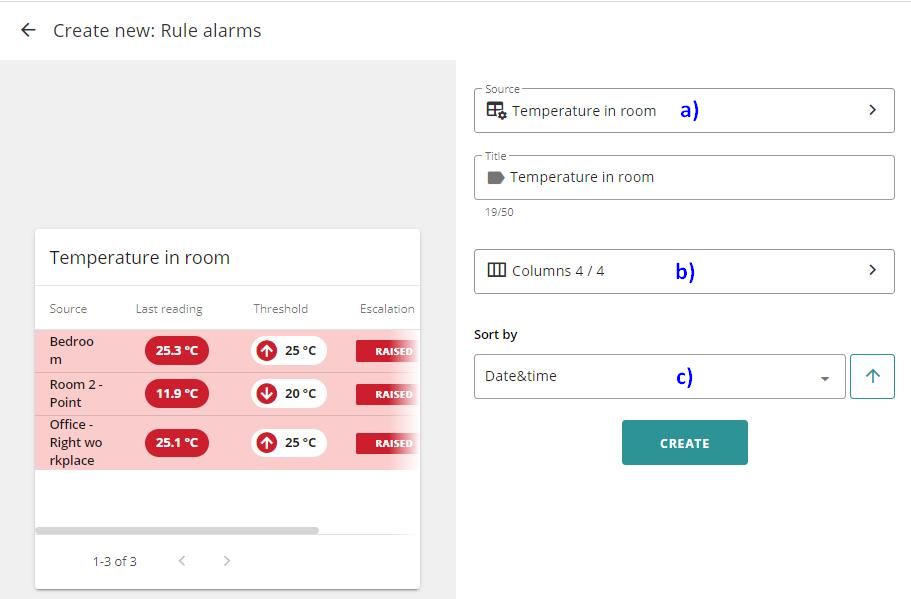
Tile configuration allows:
a) Selecting source Rule;
b) Selecting colums
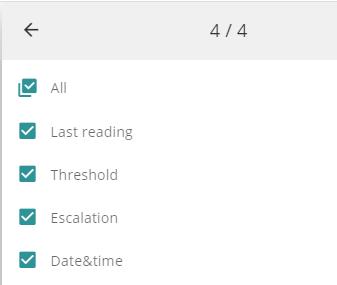
- Sorting
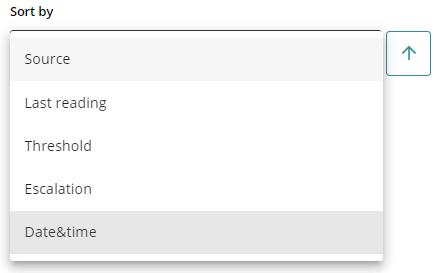
and selecting tile size (Small, Medium, Large).Monitor widget - CO2 public monitor visualization
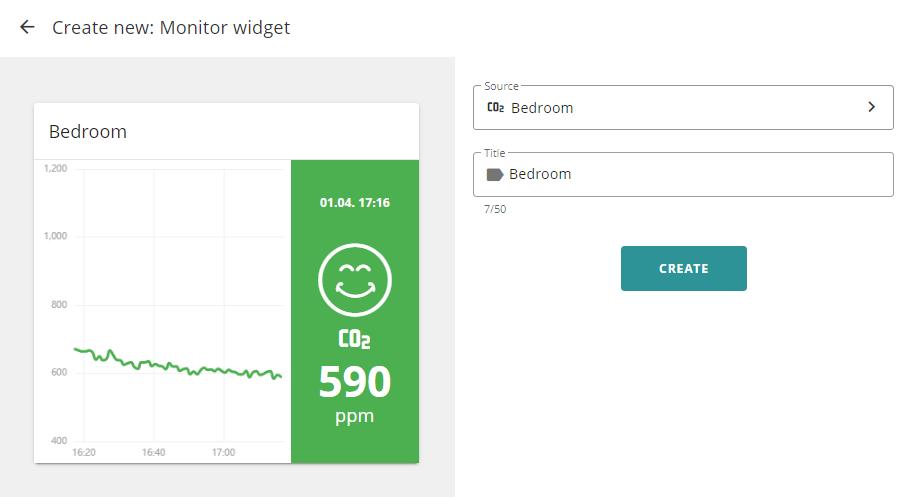
Configuration is described in the dedicated topic: How to share CO2 measurements with public.
Integrations table - displays the list of configured integrations and their statuses.
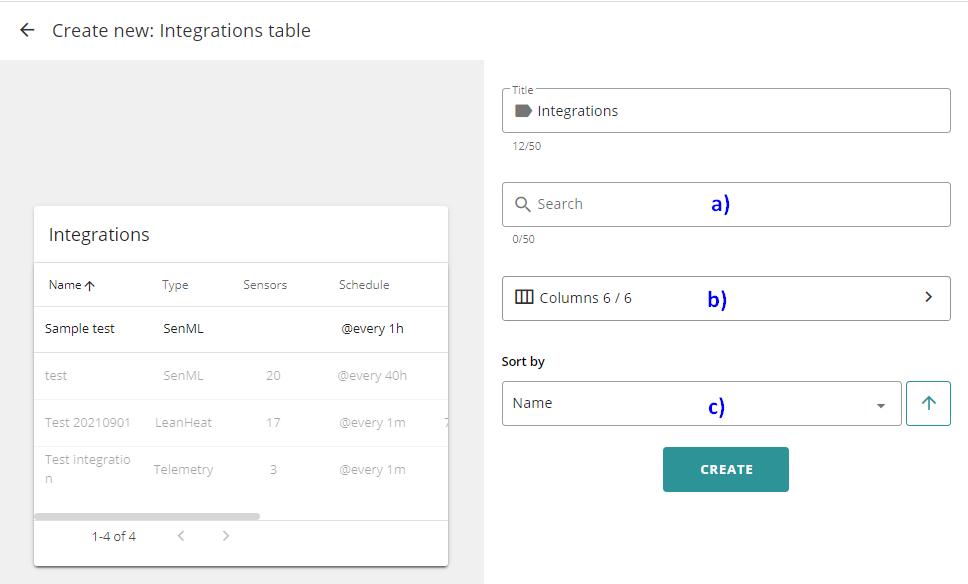
This tile configuration allows:
a) Searching configurations by Name;
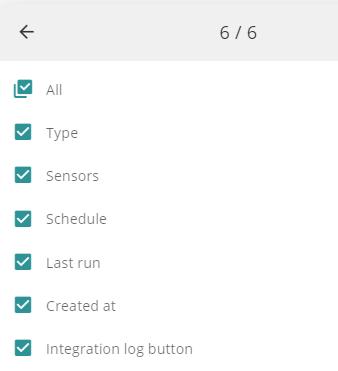
b) Selecting columns
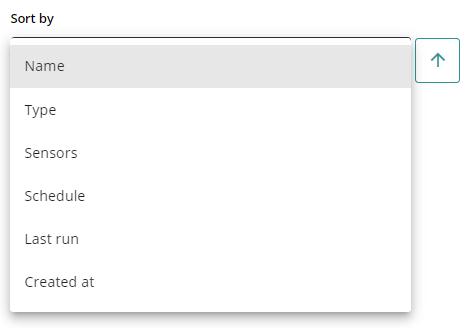
c) Sorting
and selecting tile size (Small, Medium, Large).
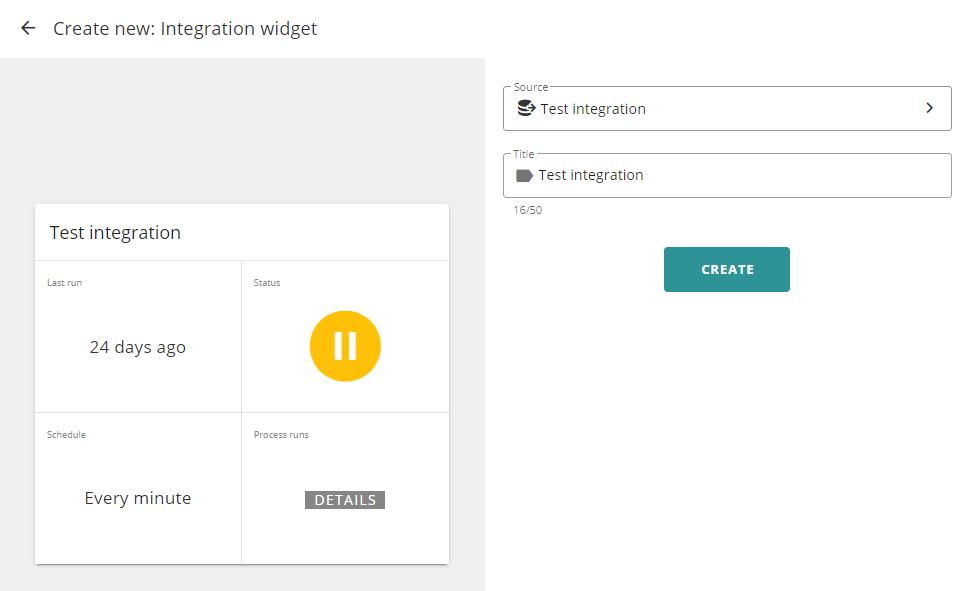
Integration widget - status of selected Integration, its last run time, schedule, and the process runs
Floor Plan widget - fixed view of floor plan
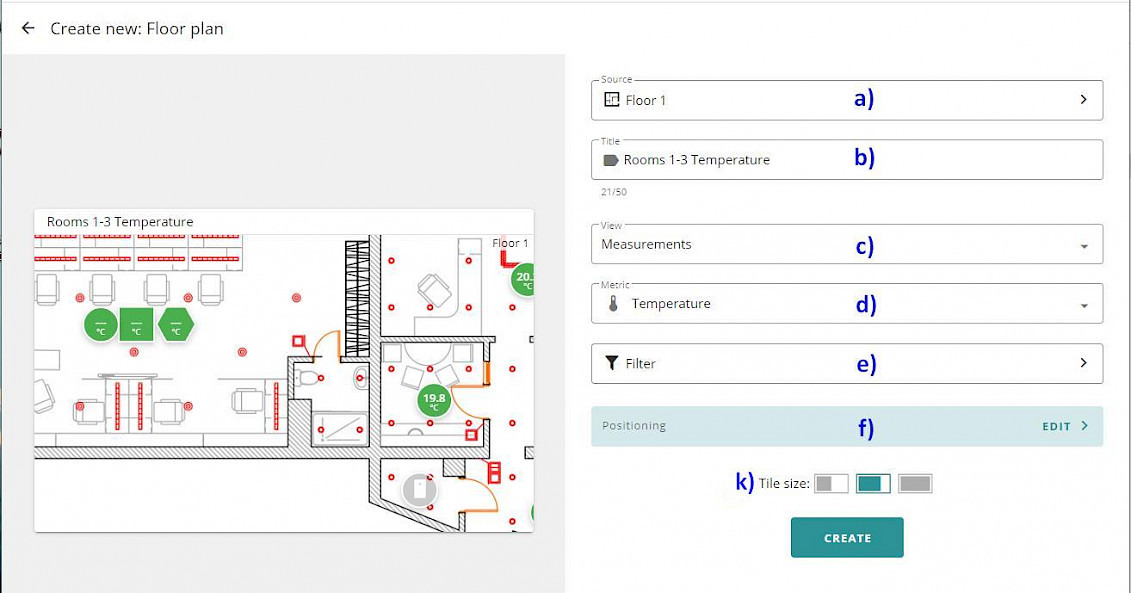
To configure this tile:
a) Select source - one of the previously created Floor plans
b) Give tile a title
c) Select the layer to view - Measurements, Alarms, or Objects
d) Select the Metric to show
e) Apply filter to the sensors to be shown
f) Configure the positioning of the plan on the tile if needed; otherwise, skip to
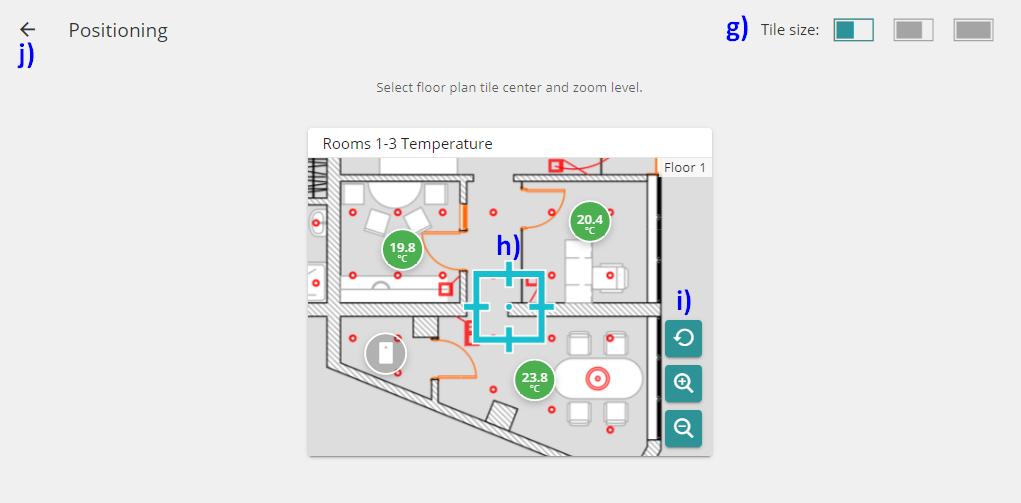
g) Chose Tile size
h) Center image using Scope marker and
i) Magnifier tool
j) Return to the main configuration screen when finished
k) Set Tile size
press CREATE button to finish
You have to log in to reply.