How to configure Line widget

aranet-techsupport
Posted: 29.04.2022 13:29
Modified: 30.07.2026 21:54
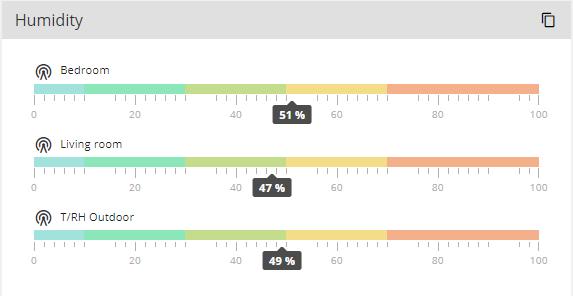
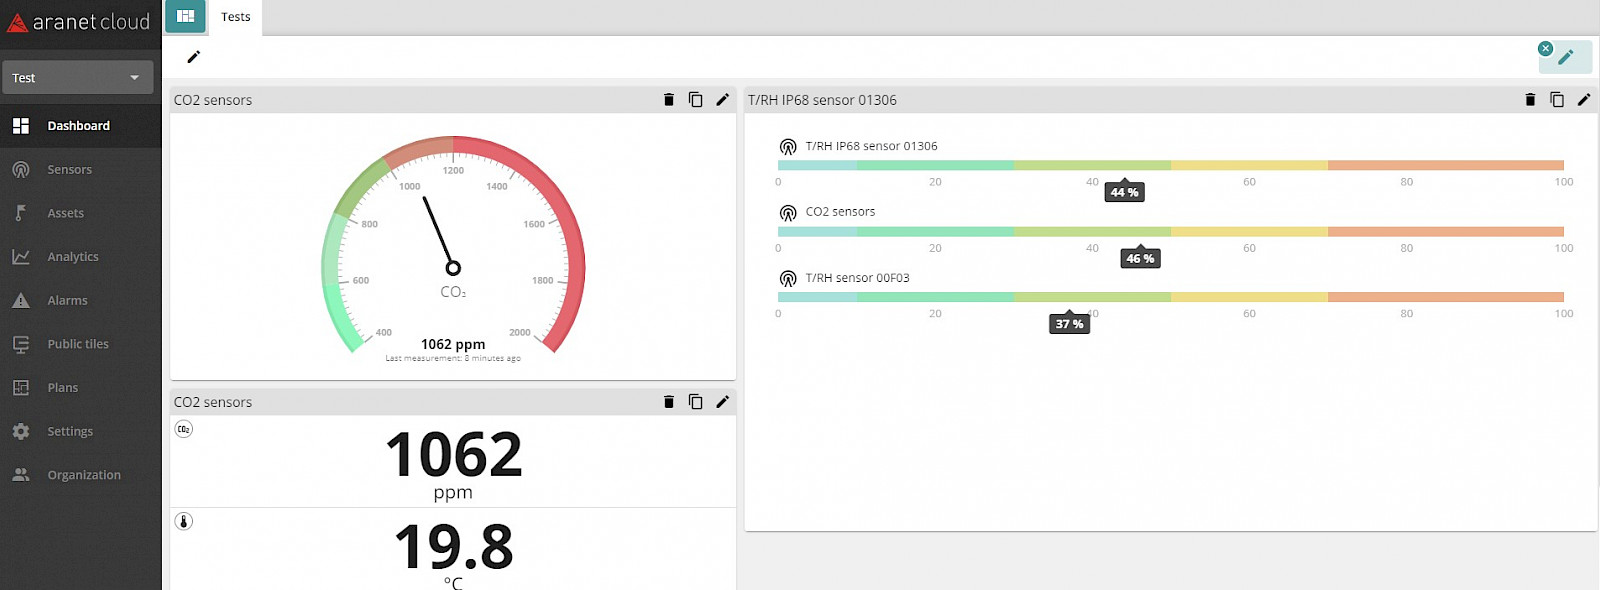
Aranet Cloud dashboard tile Line widget presents multiple sensors one metric data with custom-defined colors and thresholds in a line view.
The tile can be created in a usual way: from the Dashboard view:
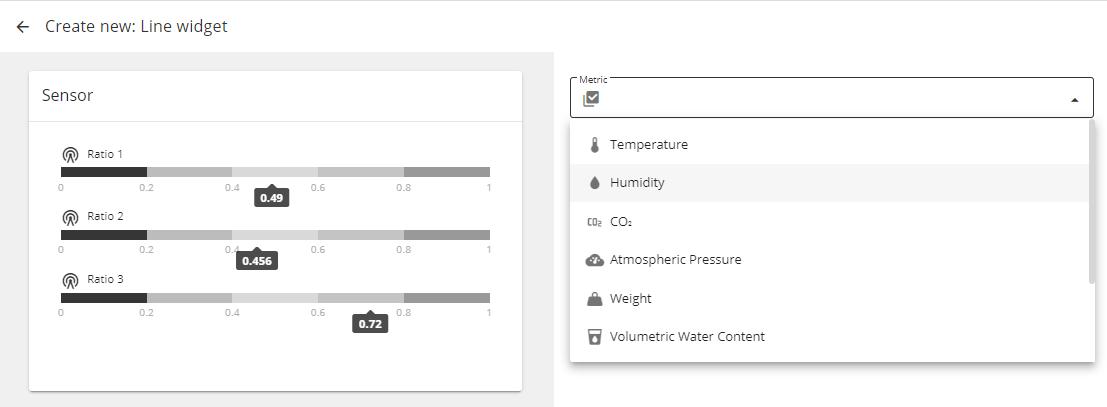
Select the Metric of the tile from drop-down list:
Select the source of the data for the tile; you can filter by Locations and Tags; click ACCEPT when finished:
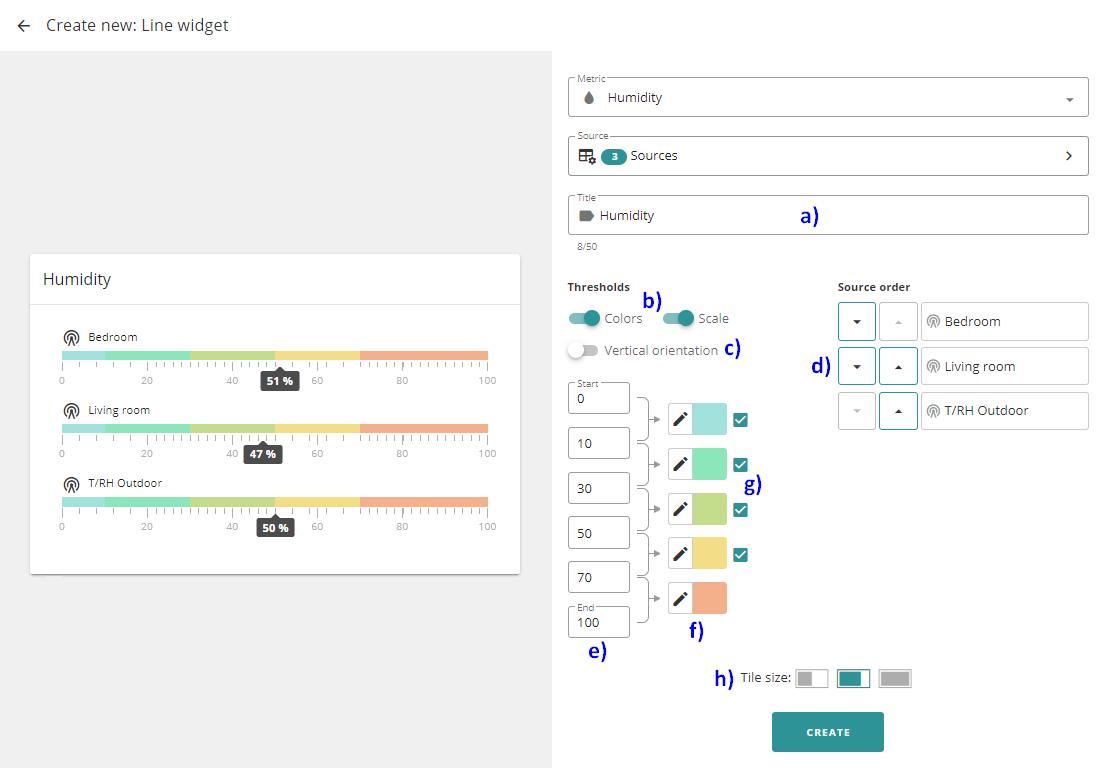
When all corrections are made, click the CREATE button to finish and exit Dashboard editing mode.
A new tile is created and placed on the dashboard. Now you can adjust its size and position as described in this forum topic: How to manage dashboards in Aranet Cloud.
For more information, please refer to this topic: Dashboards / Line widget
You have to log in to reply.